
Modern Charts
Our Modern Charts
It is not always easy to explain one simple set of data to people for them to fully understand by just using an Excel/PowerPoint chart. Sometimes it may need few charts and even some narration and it takes a long time to develop those. don’t worry about developing all those. For that, you have Modern Charts!
These perspective and interactions with data, allows you have more effective presentations of your data, so your audience can quickly have a comprehensive understanding of what the data says. If better understanding of what data says is attained better decisions are made and made quickly. Modern Charts is the only Office add-in that can allow you to show the properties and messages about your data and if very easy to use.
Key Features:
Activity Timer

Activity Timer is a Microsoft Office add-in that us a STOPWATCH + PAPER + CAPTURING all in ONE.
Key Activities
Lease balance

The International Financial Reporting Standard (IFRS 16) was introduced in 2016 and a lot of companies would require adapting the standard on annual reporting periods beginning on or after 1 January 2019. IFRS 16 specifies how an IFRS reporter will recognise, measure, present and disclose leases. The standard provides a single lessee accounting model, requiring lessees to recognise assets and liabilities for all leases unless the lease term is 12 months or less or the underlying asset has a low value. Lessors continue to classify leases as operating or finance, with IFRS 16’s approach to lessor accounting substantially unchanged from its predecessor, IAS 17.
Balance allows companies to capture all relevant leases and calculates Monthly liability and asset values while leases are active. Lease Liability value is recognizable when a company has large number of leases with different start and end dates, that its impossible for accountants to do them manually. This tool is mainly directed for use of the LESSEE.
Key Features:
Systematic Rail
Systematic Rail
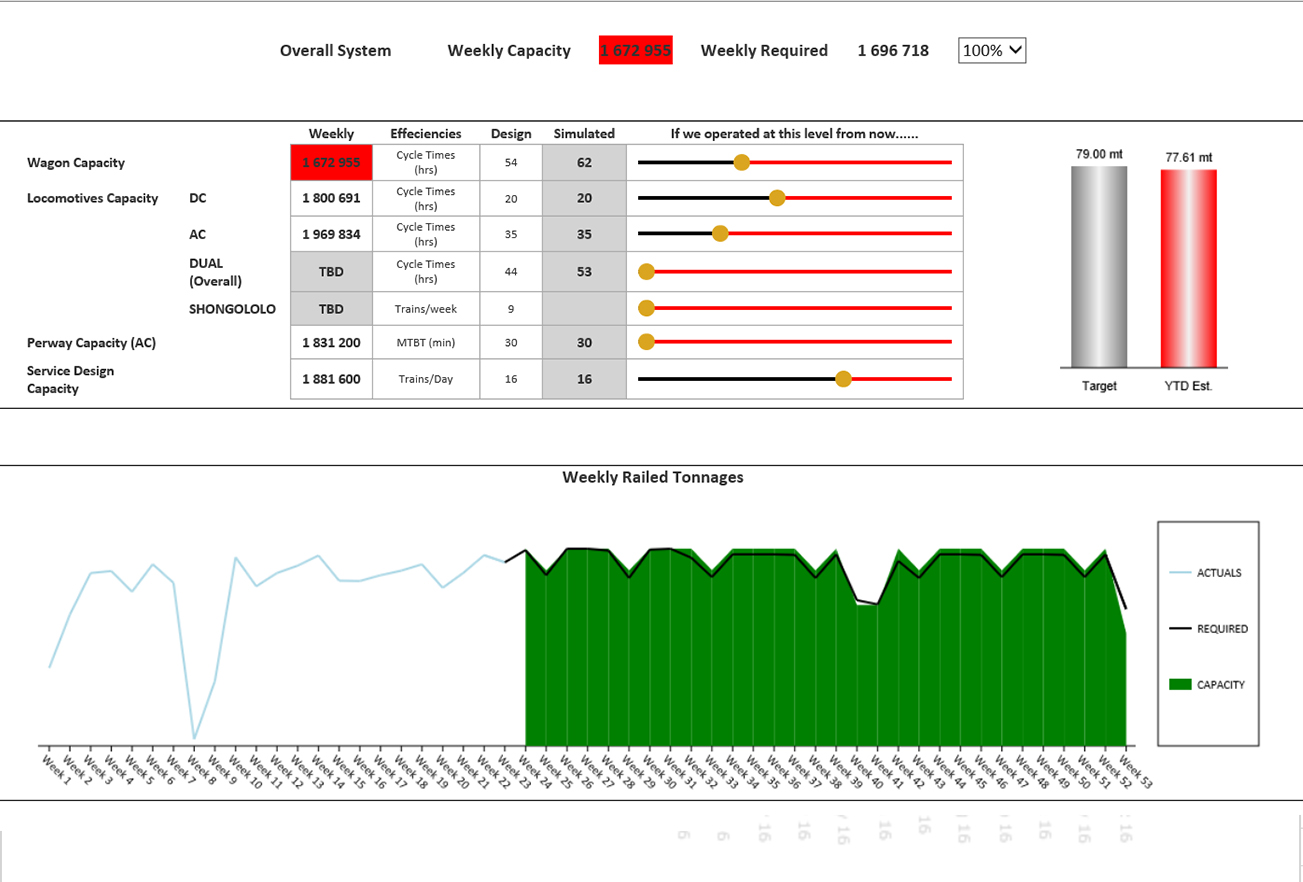
Have you ever wondered how much of your current operational challenges has been affected by previous operational decision you made? How much decisions you make today will solve or create other problems in the future? If you are running a complex enough operation, it is very difficult to calculate impact of decisions made today to tomorrow’s challenges. Therefore we created SystematicRail decision assist solution!
SystematicRail is a design to assist operations managers in a rail environment to have an improved quality of operational decisions made. SystematicRail take current state and location of assets and predict, on a rolling 7 days, impact of operational decisions made today. An operational manager can run different decisions scenarios in order to choose best decision to make today. This tool runs algorithms to show an operations manager what is the likely impact the decision made today solves a problem today and also in the future.
Key Features:
Modern Charts Excel add-in (on market)
Modern Charts Excel add-in (on market)
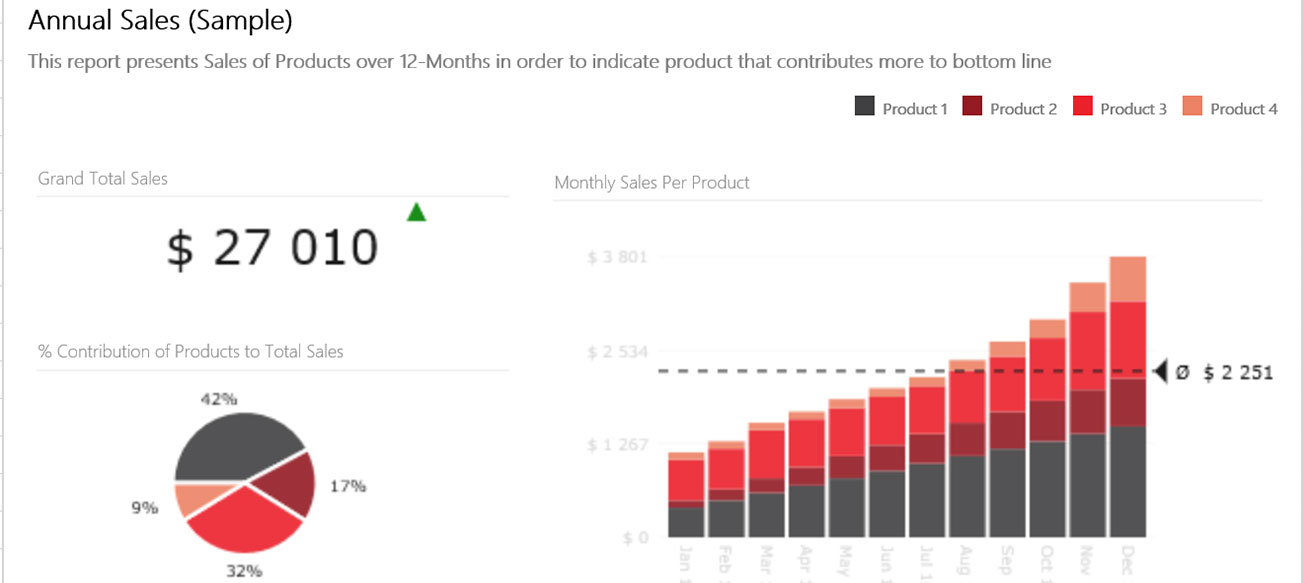
Modern Charts is an innovative Microsoft® Excel® add-in for creating professional and rich data visualizations. The add-in has an ability to blend chart types in a way that helps users explain their data better to their audiences. Modern Charts classifies charts types that are great for detailed data presentation and the ones that are great for summarised data presentation and allows users to create a combination of both to create storytelling data visualizations in seconds. These charts are plotted on different presentation layouts based on personal preferences and also the density of data being plotted.
Modern Charts employs the power of web applications technology and cloud computing to give users an ability to prepare the best data presentations at minimum possible time. This is a new and convenient way of creating data stories for presentations using normal data in Microsoft® Excel® spreadsheets. Using modern Charts saves time and as a result, saves money.
Consulting Services
If you need large mathematical models for your planning needs, Mzamose has over 10 years’ experience the mathematical modelling and prediction models. Mzamose consults in the following modelling fields:
Copyright ©2019 Urban Ginger All Rights Reserved